Metrics to be Collected
Measurements & Metrics
Measurements Collected
We will measure man hours expended during each week, as well as measure estimated man hours for the upcoming week. Issue throughput will be measured automatically by waffle.io, providing insight into how many issues get closed per week.
Metrics Tracked
Will will track test results, and more specifically, unit test code coverage. We will also track schedule slippage. For unit tests, code coverage will be automatically calculated by whichever automated tool we choose (when we begin implementation). We will keep track of test results by week as well, for those tests that cannot be automated (for instance, acceptance tests). A spreadsheet will be created for this purpose. Slippage informs the team how far off our estimates are when delivering a particular feature or work item, and will help drive our future estimates to be more accurate.
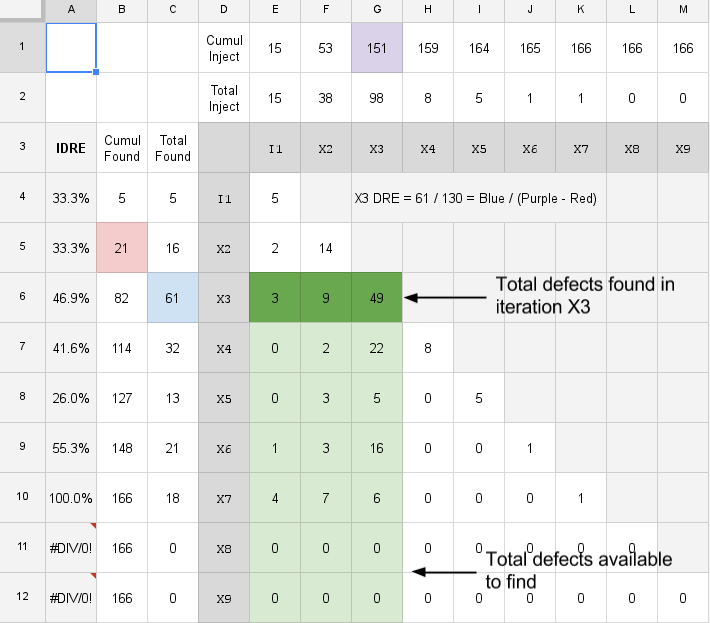
We will also maintain an IDRE chart, which stands for iteration defect removal effectiveness. The image above is an example of an IDRE chart. It is a two dimensional grid where each unit is an iteration. Each cell contains the number of defects injected during the iteration on the x axis that were found during the iteration on the y axis. The IDRE metric for an iteration n is the number of defects actually found during iteration n divided by the number of defects available to find. This highlights the fact that many more defects will be introduced in an iteration than will be found that iteration. Higher IDRE scores indicate the activities performed during the iteration were helpful for the purpose of defect removal. However, IDRE scores become more accurate later in the project (when they also become less useful). They should only be used as basic insight into the effectiveness of our quality assurance activities.