This exercise is an introduction (refresher) to basic VxWorks program development. You will also experiment with WindView and see how to use it to measure the performance of the system.
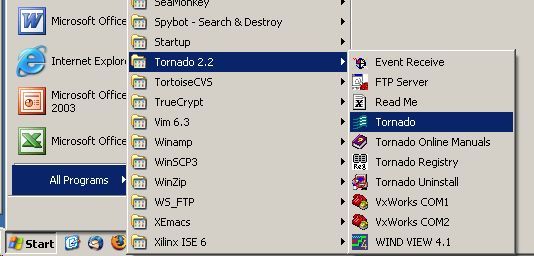
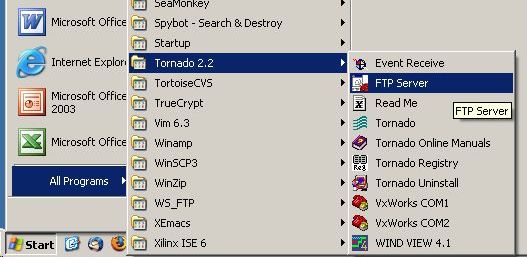
Start the VxWorks development environment, Tornado 2.2.
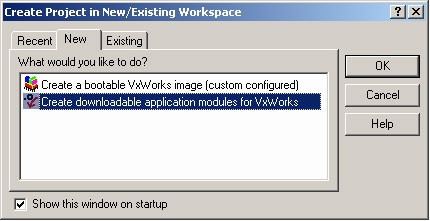
You want to create a new downloadable project.
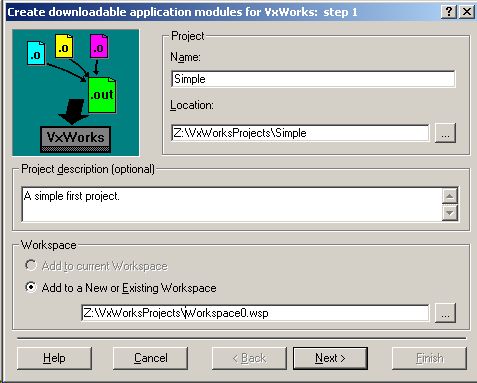
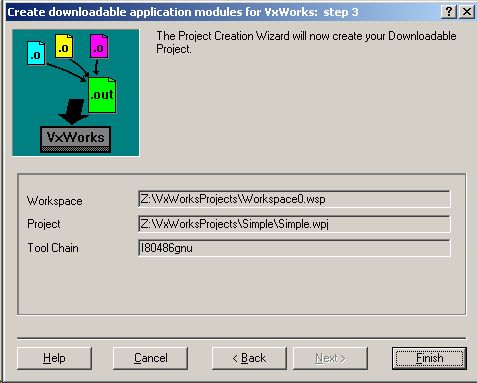
Call the project Simple. You can use your workspace for a previous course. If this is the first time you are doing VxWorks development, you need to create a Workspace for your VxWorks projects somewhere in your Z: drive. Tornado keeps information about each VxWorks project in a separate directory in your Workspace.
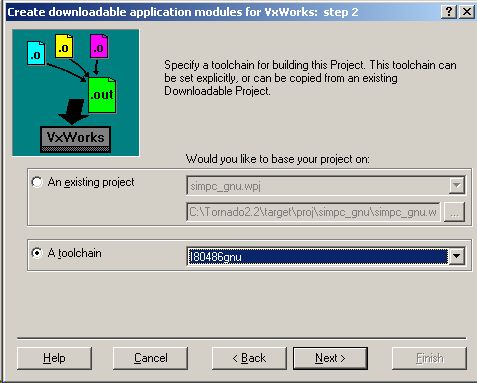
Our target systems, a.k.a. the purpleboxes, have 486 processors. Use the I80486gnu toolchain for all projects that will run on the purpleboxes.
Finish the project creation which should also create your VxWorks workspace if you did not already have one.
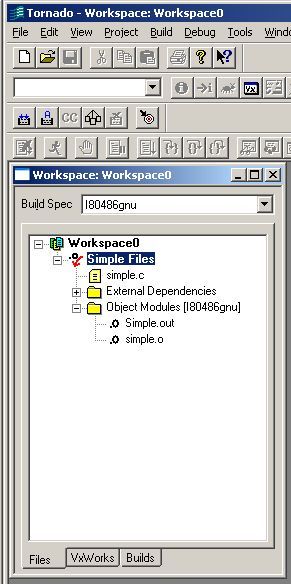
Copy simple.c to your Simple project directory. On the Files tab, right click on the Simple project and add this copied file to the project.
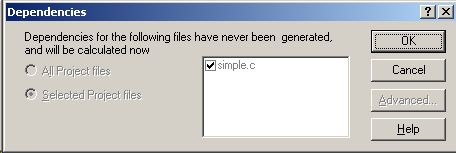
On the Builds tab, you should see the I80486gnu build under Simple Builds. Right click on the Simple Builds and rebuild simple.out. You will be asked to regenerate dependencies. Reply OK. Note that Tornado is rather good at figuring out the dependencies and what needs to be rebuilt. Be warned that it is not perfect however. There may be occasions when you have to explicitly rebuild the dependencies for your project.
Whenever you do a build the Build Output window appears. If any errors occur you can double click on the error to go to the location of the error in your source files.
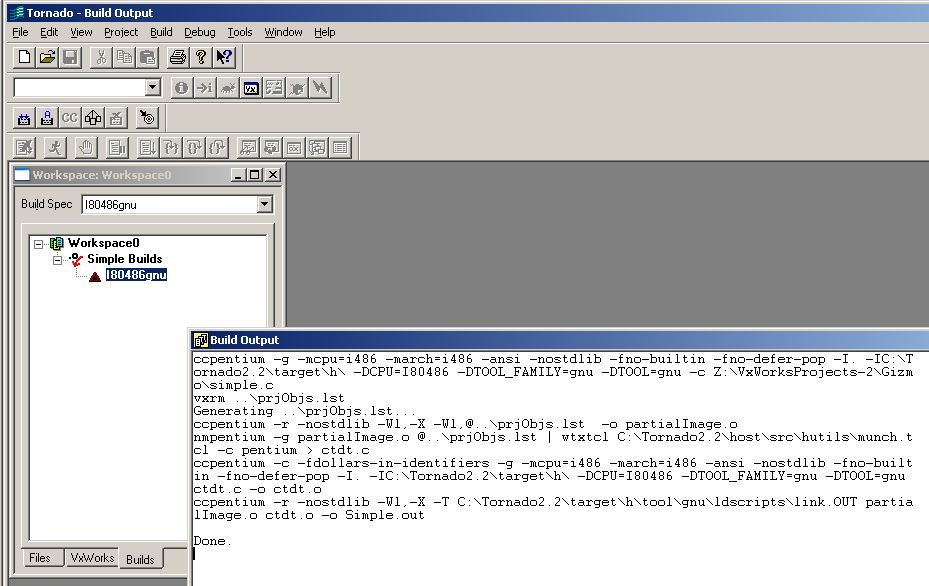
If all goes well, the build creates a simple.out file which is the file you will download to the target system.
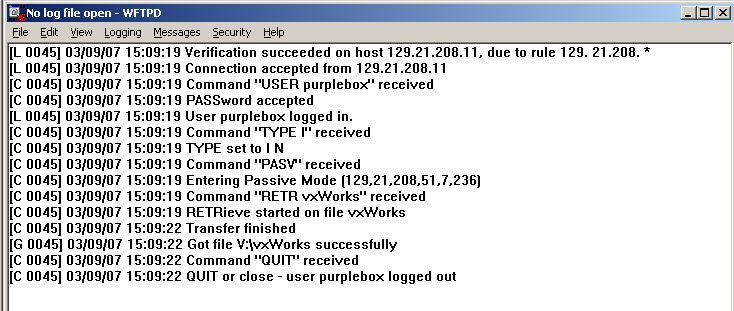
The next step is to get the target system started and have Tornado connect to it. When the purplebox powers up it ftp to the development station and download a standard VxWorks image. You have to start an FTP server on the development station before powering up the target system.
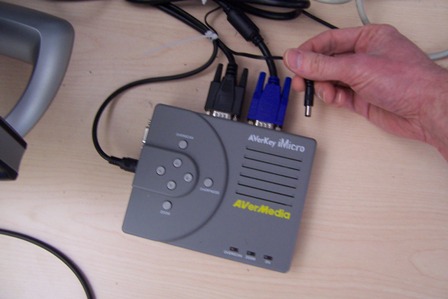
Connect the power for the AVerKey iMicro video convertor. Note that the power plug for the AVerKey and the purpleboxes are the same size but output different voltages. The power plug for the AVerKey is tied down so that, with normal efforts, it can only reach to the power input on the AVerKey.
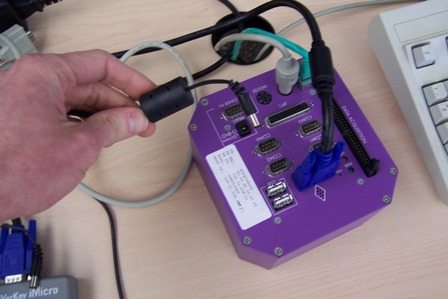
Connect the power for the purplebox. Switch to viewing the purplebox monitor by pressing the middle of the three small buttons on the lower right of the monitor.You will see the purplebox bios and VxWorks bootrom start. VxWorks will indicate that it will start the image load after a timeout period. Switch back to view the development system. You should see the purplebox connect and download the VxWorks image file.
Look back at the target monitor and verify that the target is ready by seeing the text: WDB: Ready.
Start a target server that will serve as a proxy on the development system for the purplebox. You must select the target for your development system. If you do not know the number of your development host and target, it should be on the label on the purplebox. If you do not see the list of all the targets, you need to run the target server registry file (Tornado22-registry-targets) to install that information. Exit Tornado and run the file found in the directory c:\Tornado2.2.
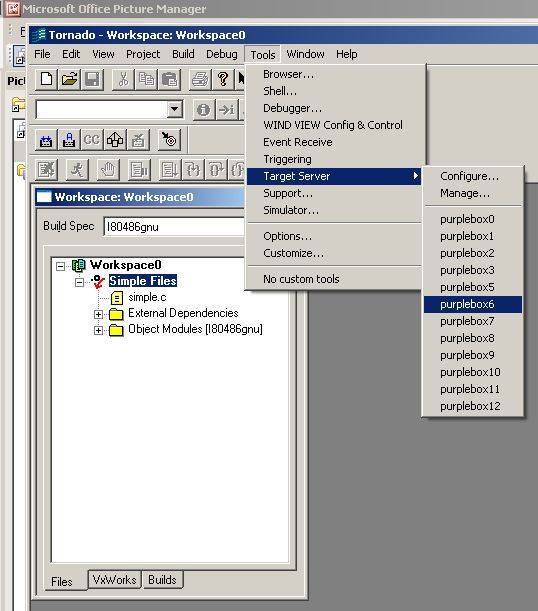
After you started the target server, look at the red bullseye target in the lower right of the development system screen. There should not be an exclamation point through the bullseye. You can double click the bullseye to see that a successful connection was made, or to see the error if there is a bullseye.
If the connection was successful, you must establish the connection between Tornado and the target server. You should only see one target server available.
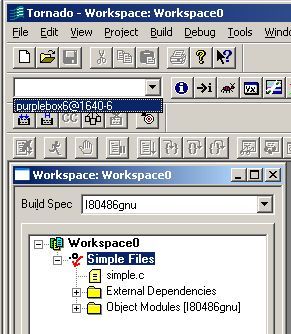
While you are developing your VxWorks applications, you will primarily interact with the target through a remote shell. Start the shell from the icon to the right of the target indicator.
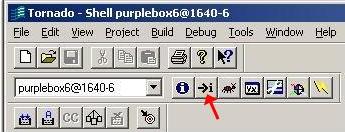
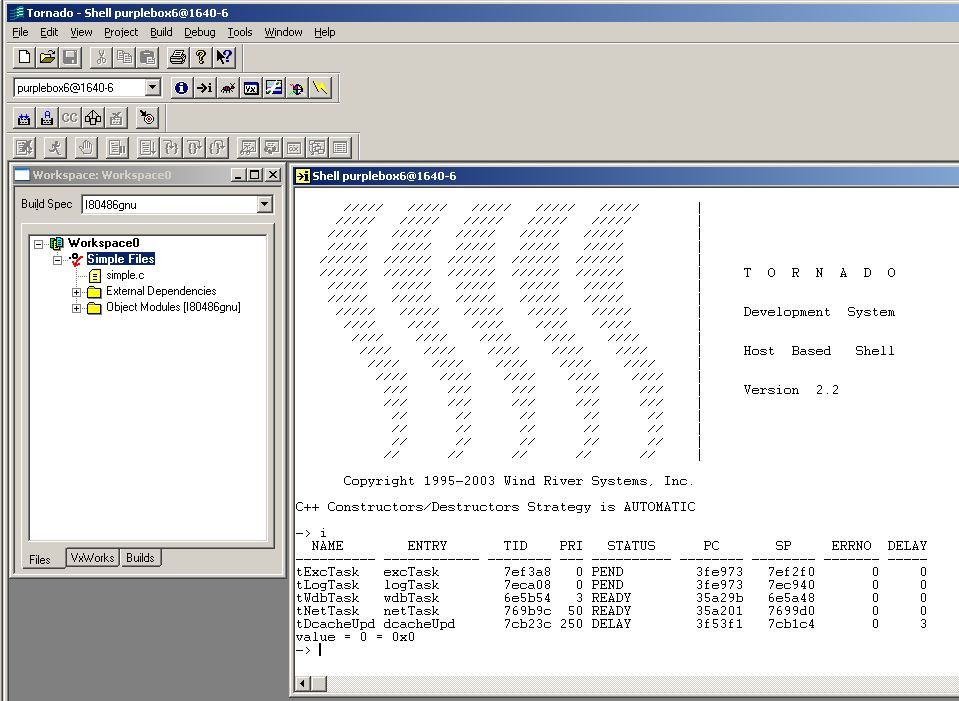
You should now see your shell window through which you will interact with the target. There are many commands that you can execute from the shell. These are described in the Tornado User's Guide. Typing help will give you brief information about some of the commands.
Right click on the Simple Files and download simple.out to the target. Run the program by executing the initialization function, progStart. You can run any function by just typing its name in the shell window.
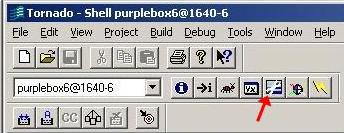
WindView is the Tornado tool that can gather detailed information about the target system. Start WindView by clicking its toolbar button.
There are several WindView configuration screens. While your application is running VxWorks will save timing data for when events occur. On the Upload Mode screen, you can choose to upload this data to the development station continually or defer it until after the data gathering stops.
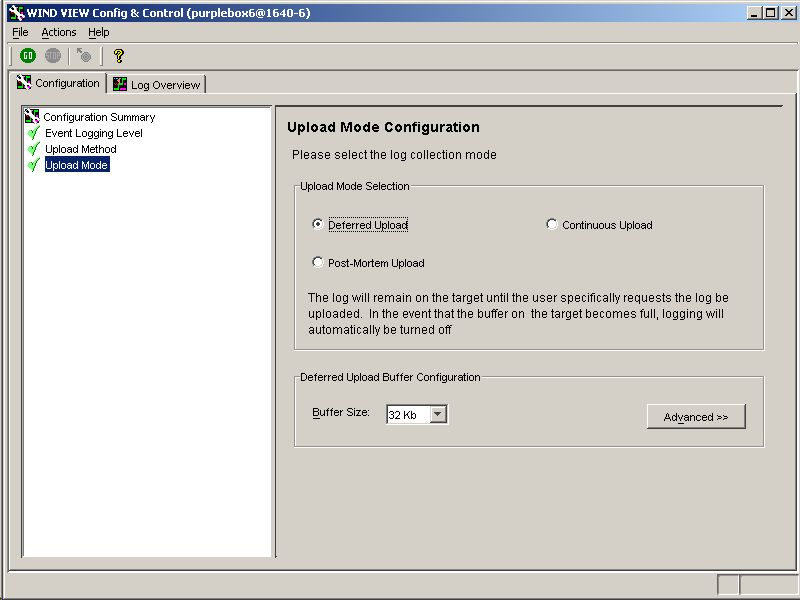
The on-target buffers are limited. The number and size of the buffers can be changed in the Advanced options on the Upload Mode Configuration screen. If you continually upload data, you will probably not run out of buffer space but the system performance is degraded. With the Deferred Upload, the system fill the buffers and then stop gathering data. Use the Deferred Upload for now. To gather data from your running application for a longer period of time you can control what events are logged. You specify this from the Event Logging Level screen.
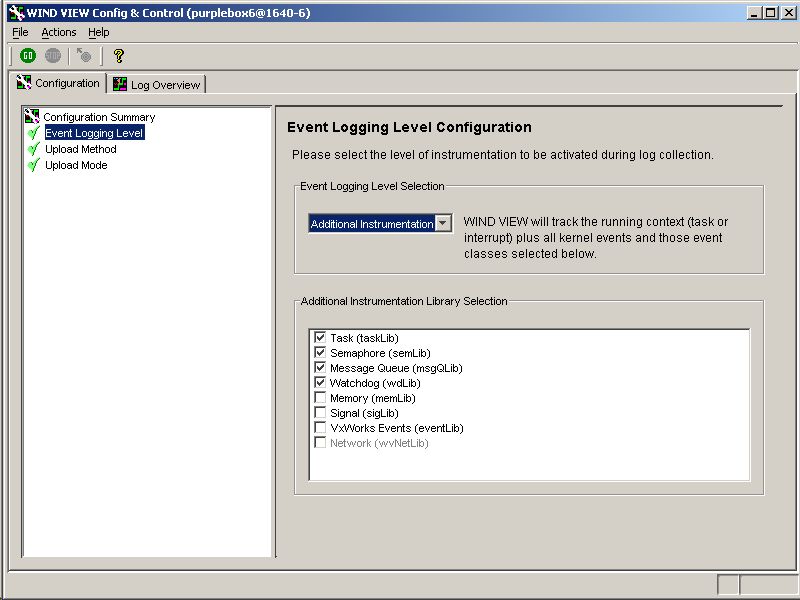
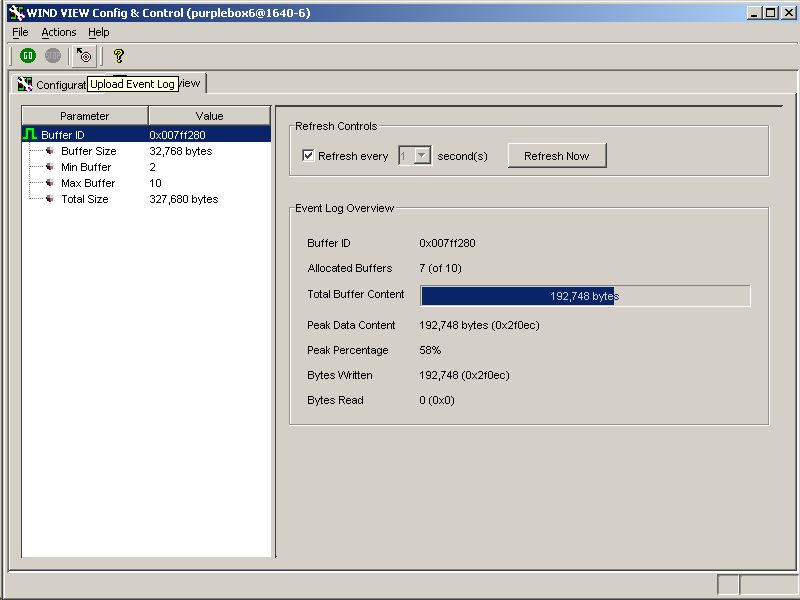
Look at the different logging levels and the choices at each level. You may need to adjust these while you are running some of your experiments. Select the Log Overview tab. This gives an indication of how much data WindView has gathered. Set the Refresh Controls to refresh every second. Start WindView logging data by pressing the green Go toolbar button.
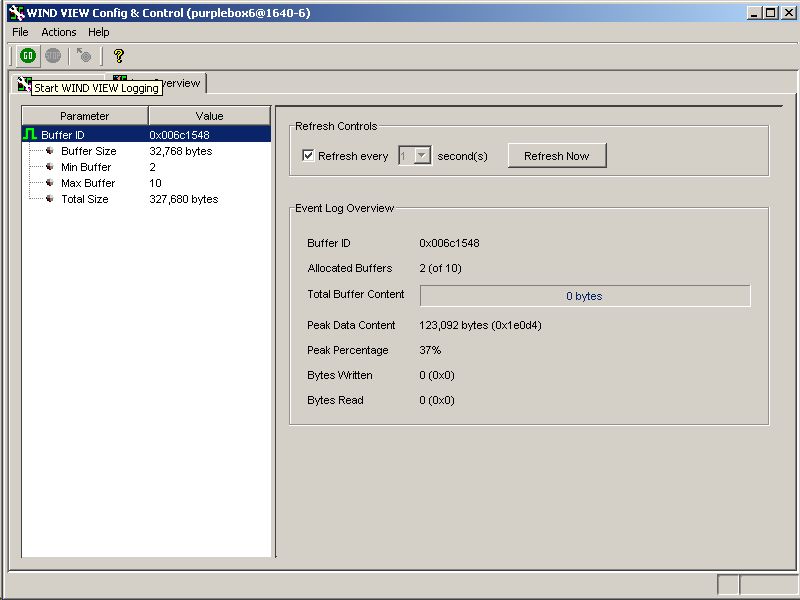
Watch the event log overview. You can either let the buffers fill and have data gathering automatically stop or you can manually stop the data gathering with by pressing the red Stop toolbar button. Upload the data to the development station by pressing the Upload Event Log toolbar button.
This will display a WindView Event Graph similar to the one below but for the application that you downloaded.
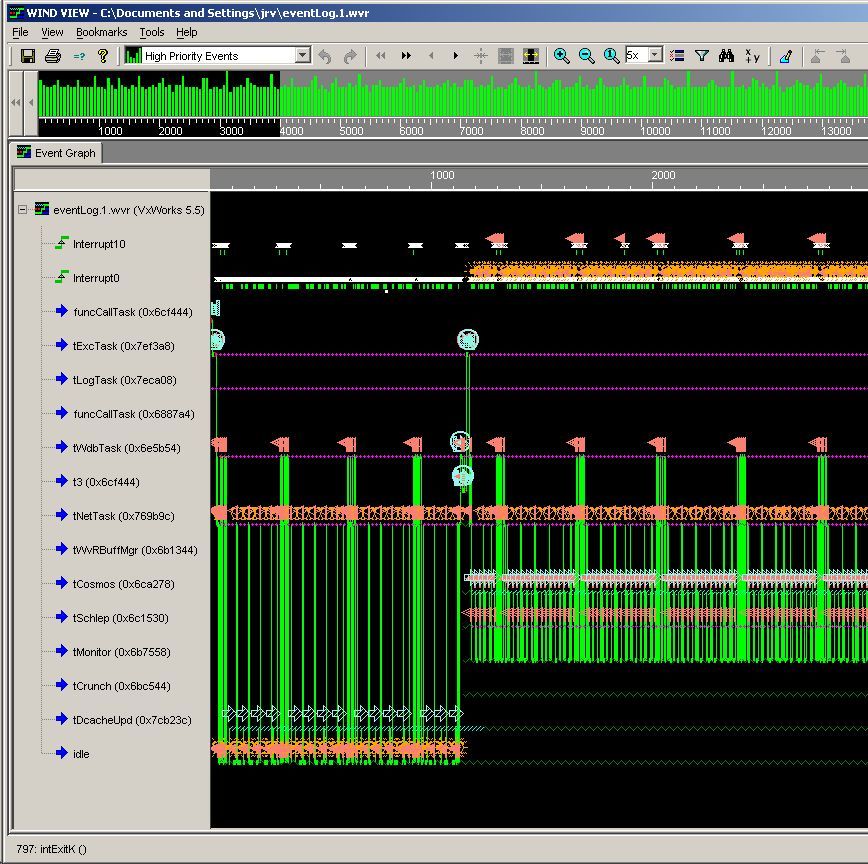
Explore the capabilities of this WindView Event Graph.
The real value for analysis is to get the actual data. Export the data to a comma separated values text file which can be easily read by Excel. Be careful when you export data. If you have zoomed in on the data, only that data will be exported.
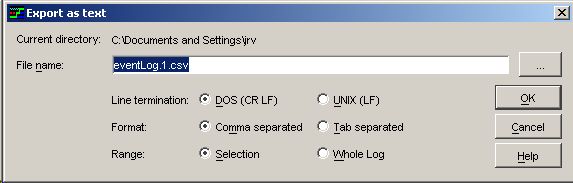
Look at this data file.