Real-Time Control Project
For this project, you will develop a PID controller
that runs on QNX. Your controller will control a plant simulator
that runs on the development station and generates the plant output
signal through the Data Translation DT9812 data acquisition board. Here is a block diagram of the system you have:
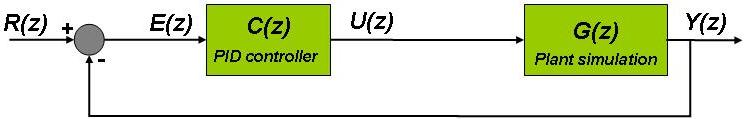
You will use a standard PID controller, described by this transfer function, to control the plant simulation:
Your program will run the PID controller as a periodic task. During each control period, you will input the current plant output, compute an updated plant control signal, and output that control signal to the plant simulation. The plant simulation outputs the plant output on analog output channel 0
of the DT9812. It reads the plant control input on analog input 0.
When you have your test fixture functioning, you will experiment
with the PID controller constants (kp, ki, kd) with the goal of minimizing both the overshoot and rise time of the plant. Use the table at the end of the Introduction to Z-Transforms lecture notes for heuristic guidelines for the effects of changing the three constants. Measure the rise time as the time from the change of set point to a plant response of at least 95% of the change in setpoint value.
Running the Plant Simulator
Starting the plant simulator requires two steps. Start the CSPS simulation for this assignment by executing the Real-Time Simulation shorcut in the Start menu. This will open two Windows cmd windows, one for the CSPS computation kernel, and the second for the user interface. The shortcut also loads the appropriate plant and I/O port specifications for this assignment. There are 5 commands available to you through
the simulation's user interface. These are:
- start - start the plant simulation running
- stop - stop the plant simulation
- logio - save data on the input and output of the simulation to a
comma-separated-value file. After entering the command, the
interface prompts for the name of the file.
- stopiolog - stop the logging operation and close the log file. In the log file, you will see a timestamp, the plant input and output. This plant simulation actually generates two outputs. The plant output that you are trying to control is labeled "wheel".
- quit - exit the user interface. This will also close any open log file and shutdown the simulation kernel.
Guidelines for Implementation
- You should follow good object-oriented practices for the design of this project. Be sure to design a structure which allows for the control algorithm to be easily replaced.
- This should be a multi-threaded application. Possible threads include: input analog plant values, compute control output, output analog control values, user control of the program.
- In the TFO to DIC transform, ensure that DIC range is not exceeded. Clip the input to the transform, or the output from it. Be aware of wraparound. Your clipping should clip out-of-range negative values to a DIC of 0, and out-of-range positive values to a DIC of 4095.
- Make appropriate use of QNX timers and synchronization primitives so that you never have to use
sleep()
in your code.
Notes
- There is information about working with the analog input in the Athena manual on pages 51 through 54. Configure the analog input to have a range of +/- 10 volts. The data acquisition system I/O map and register descriptions start on page 36.
- You may want to consider using the analog input scan and interrupt feature to get periodic scanning of the input. These features are described on pages 55 and 56 of the Athena manual.
- It will be convenient if you have a way to control your test fixture, and adjust the PID parameters, without stopping the system. You can gather this input in another task that runs at a lower priority than the controller task.
- There are two approaches that you can use for capturing data. The first is the logging capability in the plant simulator. This will save a file which you can import into Excel. You might also want to consider saving the data within your controller program, and writting it to a file in the
/tmp directory on the purplebox.
- If you have any problems starting the CSPS kernel and the user interface from the Start menu, use these steps:
- Open a Windows
cmd window. Navigate to C:\CSPS.
- Run the CSPS kernel,
CSPS_W32_Kernel.
- Open a second Windows
cmd window. Navigate to C:\CSPS.
- Run the user interface program with these command line parameters:
SimpleUI CarSimPlant.plt CarSimPorts.prt.
- Sometimes the DT9812 data acquisition system gets wedged. This would be indicated by errors coming from the CSPS kernel or user interface. If this happens, you need to shut down the CSPS, and make sure that its spawned tasks are closed also. Then disconnect the USB cable from the DT9812 for 5 to 10 seconds. After reconnecting the DT9812, you can test it using the Data Translation GO! application.
- You can find a number of websites with guides for emperically tuning PID controllers. Some students have found this useful; others have not. The Wikipedia PID controller page has a section on manual tuning.
Submission Instructions
After experimenting with different values for the PID controller constants, settle on the set that you feel provides the best tradeoff for minimizing both the overshoot and rise time. You will write a report, as a single Word document, describing the results of this experimentation. This report should include the following woven through the text of your report.
- Professional formatting including: page numbers, headings with section numbers, report title including identification of the team.
- A description of your experimental setup including the implementation of your controller with a time line of operations performed each cycle.
- You experimental results for 4 sets of PID controller parameters. In addition to the parameter set that you think yields optimal control, select 3 other parameter sets which you think are interesting. Describe what is interesting in each set. In addition to your discussion of each experiment, provide the following for each experiment:
- The values of Kp, Ki, and Kd
- Plot of the plant output. Use appropriate labeling of the x and y scales. The horizontal scale should be in units of real-time.
- The percentage overshoot and the rise time.
- A brief writeup (2 pages max) that describes your experimental approach for exploring constant values, and your observations of the effect of varying the three PID control constants.
- Concluding remarks about this project.
Create a zip file that holds the Word file with your report, and your QNX source code and include files. Before the date specified in the schedule, deposit this zip file in the Real-Time Control Project dropbox in myCourses.
Grading
Your work will be evaluated using this grading rubric.
$Id: RealTimeControl.html 138 2013-03-31 05:10:48Z jrv $