Project Overview
In this project, we’ll work on a complex user interface written for a static website. We are making a single page application with multiple UI components that all interact with each other. There will be textual elements, configuration widgets, and a visual rendering using embedded Scalable Vector Graphics (SVG). They will all have an element of:
- Visually generating something
- Downloading the product when done
On a “full stack” system, our project would integrate with a REST API on top of a database backend. For this project, however, let’s just focus on the front end.
We will all be using React.js as our framework. React.js is a framework that adds a significant amount of abstraction on top of the traditional DOM manipulation. So, for this project, we will be adding layers to our stack each iteration to show how they all fit together. (In a “real” project, you might start with React from the beginning.)
Unlike our previous projects, we will be focusing a little bit less on testing and more on continuous delivery (CD). The CD in this case is your site being deployed on GitLab. We will cover front end testing in class, we encourage automated testing whenever you can, but we won’t be providing test cases for each iteration as before.
Teams
Your teams have been randomly assigned, with no overlap with the DB project.
COVID-19 Change Let’s use the same teams as the RESTful API project. We’ll be using the same groups on GitLab, only with new repositories named react-abc123 where abc123 is your username.
Setup
Can I use X framework?
Sure! But this entire project is designed for you to not need to use a framework (other than React). The web front end landscape is filled with tons of frameworks and tools that can make you more productive… but… they also can hide details that get in the way of your education. Think of it this way: a framework is the product of engineers doing things this way again and again and want to speed up the process. Lots of frameworks aren’t necessarily designed with beginners in mind.
That said, challenge yourself! If you feel like stretching yourself to using a responsive design framework like Bootstrap or Foundation, go right ahead. If you want to use libraries like moment.js to handle time - go for it. For visuals, a popular library is D3 - but that is likely to be overkill for this. There are a myriad of libraries provide fancy UI widgets that you can use too.
Projects
Here are the individual project descriptions.
Tessellation Maker
A tessellation is a drawing that, when repeated, fits together in a broader image. In this tool, your user will be modifying and styling a small shape, and then seeing how it gets rendered and repeated in a larger shape.
The project will somewhat resemble this fractal maker (source code) where you modify a small polygon and then see the effects immediately in a larger image.
Of particular use to you will be the transform() property in CSS (docs) that will allow you to do the actual tessellating. Note that transform started in SVG and has since migrated to CSS, so it may differ slightly from, say, Inkscape to a browser.
Voronoi Diagram Generator
A Voronoi diagram is a way of partitioning a space where the style is based on the nearest anchor point. These diagrams appear in nature, society, and are useful in the graphic arts and city planning. There is some complex mathematics behind Voronoi diagrams, but for our purposes we will be doing a very simple variation: grid-based drawing using the Manhattan distance. Your diagram will look somewhat like this one, with your own flavoring and design choices of course.
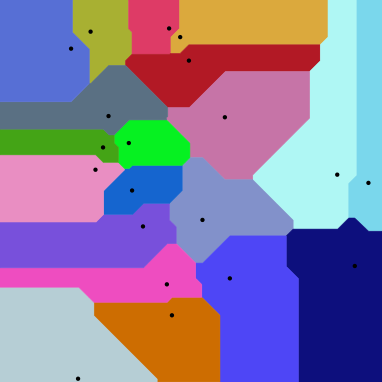
The algorithm need not be very efficient for this project. A user can define which cell in the grid is considered an anchor point and what color it should be. Then you loop over every grid cell and then compute the Manhattan distance to every other anchor cell and color it according to the closest anchor. How you handle ties is up to you.
Your users will be able to input and tweak various different kinds of settings to get their Voronoi diagram to look the way they want. Much like the fractal generator above, your users will be able to download the generated SVG.
Discussion Tracker
This is a tool that I haven’t seen out there but I think would be helpful. When you are conducting an interview, you want to flag certain moments on a timeline to come back to or track how much someone is talking. Different situations would call for different “events” that you would track in real time. These events would be configurable ahead of time, and would be styled differently visually.
Here’s a scenario. A board game designer is conducting a playtesting session. She wants to track how people spend their time, how long turns tend to take, and how much variation there really is between players. So she configures this app to have these events:
- Rules explanation
- Red player turn
- Green player turn
- Blue player turn
- Scoring calculation
- Chit chat
Each of those events have a big button and a unique color associated with them. Then, she hits a start button and the session is put into recording mode. The event starts with Chit chat and then at 45 seconds goes into Rules explanation, then 3 minutes later goes into Red player turn. As this is happening, two simple charts are being generated: a color-coded timeline of each event, and a “pie chart” of how much time is spent in each event (the pie chart can be a multi-colored rectangle). At the end of the session, she can download the timeline data in CSV for analysis later on.
Of course, the above is one example. Ideally, we want a dynamic number of types of events, change the colors. The assumption is that the session is in only one “state” at a time and tapping an event button during recording changes that state (e.g. chit chat and red player turn can’t happen at the same time). The buttons will need to be big. The app should work on small screens, like a phone. For the timeline and piechart, you can use SVG if you wish, but for initial prototypes you can work with a background: linear-gradient(). Here is how it would look:
HTML:
<div id="timeline"></div>
CSS:
#timeline {
  width: 100%;
  height: 0.5em;
  background: linear-gradient(90deg,
      rgba(26,43,222,1) 0%,
      rgba(26,43,222,1) 5%,
      rgba(39,212,45,1) 5%,
      rgba(39,212,45,1) 41%,
      rgba(26,43,222,1) 41%,
      rgba(26,43,222,1) 100%);
}
You can see this on codepen.io.
REACT1: Setup and Layout Sketches
Please name your branch react1-dev, and then when merged into master, tag with react1.
This project requires you to have completed the setup instructions
For this iteration, let’s just work on HTML and CSS to get the overall layout of what UI elements we need and how they are arranged on the page. This is just an initial layout so you can get feedback from your group on how it looks. The CSS will be far from done, but the goal is to get things sketched out to get feedback.
Everyone will need to put HTML form elements, such as dropdowns, text boxes, radio buttons, color pickers, etc. A useful
For the projects using SVG, we suggest using an illustration tool like Inkscape or Adobe Illustrator to make an SVG file, then copy-and-paste that SVG file directly into your HTML to see how it would fit. To learn about how SVG and HTML interact, this article on CSS tricks is useful. Since this is an interactive SVG, you will be doing the “inline” option. You also would benefit from knowing a little bit about how SVG uses its own internal coordinate system with viewBox
For layout, we recommend using flexbox for grouped elements and the css grid layout for overall layout. You can also use flexboxes within flexboxes for the whole page.
Grading
- (20pts) Code is set up on the CD system
- (20pts) HTML UI sketch is laid out
- (10pts) Helpful feedback provided to groupmates
REACT1: Tessellation Details
Remember, you don’t need to implement the functionality for these. Just sketch what the UI would look like.
Make sure your UI sketch handles the following things:
- A place to modify the points on an SVG polygon. See notes below.
- A place for the whole tessellation to be updated every time you make a change
- A way of selecting different types of tessellating (e.g. “rotate and translate triangle”, “translate parallelogram”, “translate hexagons”, etc)
- A way of changing the look of the polygon. This could be colors, image pattern, gradient, etc. Anything that modifies an SVG
styleelement. - A way of changing other colors for the tessellation to rotate through (e.g. maybe shapes alternate between colors)
- A button for downloading the SVG as a file
- Anything else you think you might need. You can always scale back later. Ideas: status bar along the bottom, a randomize button, undo & redo buttons, presets, etc. The
react5iteration will ask you to “make it your own”, so you can start brainstorming now.
Note on modifying points for an SVG polygon. In SVG the <polygon> is ideal for this, not an SVG <path> because you will be doing some math based on the x-y coordinates of the vertices and <path>s work more like pen-and-paper whereas <polygon> use more of a Cartesian coordinate system approach. Technically, you will likely need to have your “template” tile to modify be a series of <circle> and <line>, and then you can draw the whole thing with a bunch of <polygon>s. See this documented example of embedded SVG and tessellations. For this iteration, simply hardcoding your SVGs is sufficient.
REACT1: Voronoi Details
Remember, you don’t need to implement the functionality for these. Just sketch what the UI would look like.
Make sure your UI sketch handles the following things:
- A place that shows the entire render of the diagram in SVG
- A way to change the grid size
- A way to toggle anchor points
- A way to change the style of an anchor point
- A button for downloading the SVG as a file
- Anything else you think you might need. You can always scale back later. Ideas: different strategies for handling ties, status bar along the bottom, undo & redo buttons, a randomize button, color scheme presets, etc. The
react5iteration will ask you to “make it your own”, so you can start brainstorming now.
REACT1: Discussion Details
Remember, you don’t need to implement the functionality for these. Just sketch what the UI would look like.
Make sure your UI sketch handles the following things:
- A way to define a bunch of events and their styling
- A way to display buttons for each event that is big
- A way to start and stop recording
- A way to show the user that they are in recording mode or configuring mode
- A button to download timeline data as a CSV
- Anything else you think you might need. You can always scale back later. Ideas: buttons to correct a mistake during a recording (e.g. undo), tap to show a tooltip with info about the event, a pause button, the ability to have more than one event and just have multiple timelines, color scheme presets, a text area to paste your initial config into so you can use it again later, automatically saving your config in browser storage so it doesn’t go away after closing the browser, etc. The
react5iteration will ask you to “make it your own”, so you can start brainstorming now.
REACT2: CSS, DOM Manipulation, Vanilla JS
Please name your branch react2-dev, and then when merged into master, tag with react2
In this iteration, we will be connecting some of the pieces of your existing UI to give it some functionality. We don’t need to focus on the full functionality, just parts of it this time. React will make our lives much easier once we get there, so we don’t want to go too far down the road of implementing things in pure Javascript.
The first main goal is to improve our mobile responsiveness. Using a media query, make your interface be usable at both the standard width of a desktop and at the width of the latest iPhone. (To simulate devices, use the DevTools Responsive mode to switch devices to emulate.) Now, a library like Bootstrap will have several breakpoints along the way - we are just looking for one. As an example, perhaps use the CSS grid for the desktop-sized screen, and then switch to a vertically-stacked flexbox for smaller screens. Don’t aim for perfection on this part - the more important goal is the next one.
Our second goal is to implement the core rendering functionality of our app. Don’t get bogged down in handling all of the parameters that you sketched out in react1. Those will be easier to implement once we add React. Rather, from default parameters, implement the way to draw the main part. Later, your tool will auto-update because it’ll be a React component, but for now you probably want a button to trigger your rendering for debugging reasons - so feel free to add a Render button for now. Here are some guidance for each project below.
Grading
- (20pts) Mobile responsiveness
- (10pts) Code style and maintainability
- (30pts) Core functionality is working under basic, hardcoded conditions.
- (20pts) Helpful feedback or support provided to groupmates
Tessellation
For this, you are taking the drawn polygon and rendering it into the tessellation. You will be making several copies of the original polygon and applying a transform to it. Every polygon will have a different translate to send it to its place on a grid, and then tessellation operations specific to what the user selected (e.g. flip square or rotate triangle).
To help with this, see our example of an embedded SVG in HTML and the HTML notes within it explaining the math.
Some advice for pruning your work to the core functionality:
- Don’t worry about how to drag around the points of the polygon just yet.
- Don’t worry about styling. Setting these will be easier later.
- Don’t worry about more than one tesellation operation. Focus on one, easy this round just to get your base DOM-building functionality. Tessellations can be quite mathematically involved, and this isn’t a geometry course.
- Don’t worry about rotating through colors.
Voronoi Diagram
For this, make a grid of rectangles in SVG. If you have your rectangles have no stroke and abut right next to each other, it will look like are one shape. Iterate over your rectangles compute the Manhattan distances to every anchor point. Then, set the style of the box according to the nearest anchor point.
This iteration is where you want to figure out how to handle ties. If a rectangle is equidistant to multiple anchors, how should it be styled? It should be style differently than the other boxes (i.e. don’t just pick a random anchor to go by). The example from Wikipedia showed boxes that were split. One way to do that is with linearGradient coloring - I described that for the Discussion tracker. Another idea is to replace the rectangle with a 2x2 of smaller rectangles and then recompute - most ties will be broken at that stage. Those are just our ideas. You may have another ideas.
Discussion Tracker
For this, you’ll want to implement the two graphs based on event data. You can just hardcode some fake data at the moment - it’ll be easier to get that data from React when we go there next iteration. For now, go from a list of timestamp-event pairs and make the two graphs. The challenge this time will likely be in (a) going from time in Javascript to proportions on your graphs, and (b) updating your graphs based on those proportions.
It would also be a good idea to look into how to schedule updates. This graph will be continuously updating as the timer continues, so coming up with a reasonable interval to update the graph without draining their battery would be nice. If you want to forge ahead and implement continuous updating, go for it. But this part is optional, just do some reading on it.
REACT3: Converting to React Components
Please name your branch react3-dev, and then when merged into master, tag with react3
If you are behind on the project at this stage, heed our advice: don’t get started on this part until you have finished and stabilized react2. Converting from one architecture to another is nigh impossible if the system unstable to begin with.
Do a Getting Started tutorial. There are two options: a conceptual guide of the main concepts and a practical guide. Both are great, but we recommend doing the latter practical guide with Tic Tac Toe. Feel free to do it in your existing codebase or in a separate repository. If you feel like you’ve got a handle on things, feel free to quit the tutorial and switch over to your project because we won’t be grading your completion of these tutorials.
Most of the work this iteration will be to break your code and then repair it for the “React way” and then get back to your original react2 functionality. That’s fine. Once you do that, however, you’ll find that incorporating lots of other parameters and auto-updating your rendering will be much easier anyway. So the pain of this week will pay dividends the next two weeks.
Converting to React should take these broad steps:
- Define components. Every piece on the UI that needs to do updating or be updated needs to be a component. Every UI widget should be its own component. Every atomic piece of the rendering should be a component. I recommend defining all your components in separate JS files in your
src/directory, and then starting this next step. - Remove your debug-run button. Everything will be auto-updating, so we won’t need it anymore
- Figure out your state. One of the most important parts of the React guides is Lifting State Up. Read it (or read it again). Remember that state is mutable and properties is immutable and they are kept in sync. Determine a minimal way to represent your state, and decide on where that state will live (usually at a top-level container).
- Write render methods. Move your existing functionality to
render()methods on each component. Get the initial drawing working, but don’t worry about breaking run method. This part will be also converting your HTML code to JSX. - Parameterize render methods. Initialize every component so that it gets the top-level state of your app passed to its
props. - Bind event handlers. Once you get the above, now it’s time to start hooking up event handlers using
bind(). Note how the Lifting State Up guide organizes their event handlers and passes them around.
The goal for this iteration is for feature parity. You may find opportunities to allow your widgets to now control various parameters of your rendering. If it’s easy to do that, go for it. Otherwise, stability at the end of this iteration is what is most crucial.
- (10pts) Core functionality still working
- (20pts) Using REACT.js component structure in a conventional way
- (20pts) Helpful feedback or support provided to groupmates
REACT4: Configurability Features
Please name your branch react4-dev, and then when merged into master, tag with react4
For this iteration, focus on allowing your product to be configurable. Any of the dead input from REACT1 should now be hooked into your main functionality. Be sure to check on the point breakdown of functionality if you are seeking partial credit.
Tessellation
- (20pts) Rotating styles
- (20pts) Changing the style of the polygon (however you interpreted that for your product)
- (20pts) Download SVG button. Note: the SVG should look identical to how it did in the browser - this means changing the style attribute for look and feel and using CSS for UI functionality like hover.
- (10pts) Make the points draggable. Take a look at the source code for the Fractal Maker, particularly the Drawer.js and Dot.js and how they interact. The syntax on this project is old React syntax - the way you’ve learned to use React is much cleaner now. But, focus on the design decisions he made: a Dot has no state but reacts to the properties of
pos.xandpos.y.
Grading note: this iteration does not require you to provide feedback to your groupmates, due to our lab meeting scheduling constraints.
Voronoi
- (20pts) Toggle anchor points
- (20pts) Changing grid size
- (20pts) Download SVG button. Note: the SVG should look identical to how it did in the browser - this means changing the style attribute for look and feel and using CSS for UI functionality like hover.
- (10pts) Changing anchor styles
Discussion Tracker
- (20pts) Define different event types & styling
- (10pts) Starting and stopping recording
- (20pts) Download timeline data as CSV
- (10pts) Pie chart updated live during recording
- (10pts) Timeline updated live during recording
REACT5: Make it Yours
Please name your branch react5-dev, and then when merged into master, tag with react5
For this portion, we want you to add your own feature(s) to improve the tool in a creative way. We want you to do two things: (a) get usability feedback and (b) add a new feature that you believe your tool needs.
Get feedback. Show an early iteration of your user interface with someone whose feedback you trust. We’ll call this person your “beta tester”. This can be a member of your group, a friend, a roommate, family member, etc. Just not the instructor or TA. Ask them how you can improve the user interface, and get some ideas for new features. Everyone has opinions on UIs - be gracious and just listen for this conversation. Don’t be defensive.
Add your own feature. Choose a feature that enhances the tool in some way beyond what we asked for. This should be a non-trivial feature. We will grade you on both your choice of feature and its implementation. Your choice of feature does not need to come from your beta tester - it could be your own idea.
Add a file called REACT5.md with markdown-formatted description of the following:
- Who did you show this to?
- What did they suggest you can improve or add? Make a bulleted list.
- What feature did you choose to add?
Since this iteration is the last one of this project, we’ll be grading additional aspects of the final product.
Grading:
- (20pts) Base functionality
- (10pts) Overall maintainability and design choices
- (10pts) UI usability
- (20pts) Mobile responsiveness
- (10pts) Good choice of non-trivial feature to add
- (20pts) Implementation of additional feature