Overview
You'll build a simple waiting-line system, watch it get overwhelmed under realistic load, and then redesign it to hit a service-level target — at the lowest cost.
Simulator: simulations4all.com/simulations/queue-process-flow-simulator (opens in a new tab — keep this activity page open alongside it)
Part 1: Build the Starting System
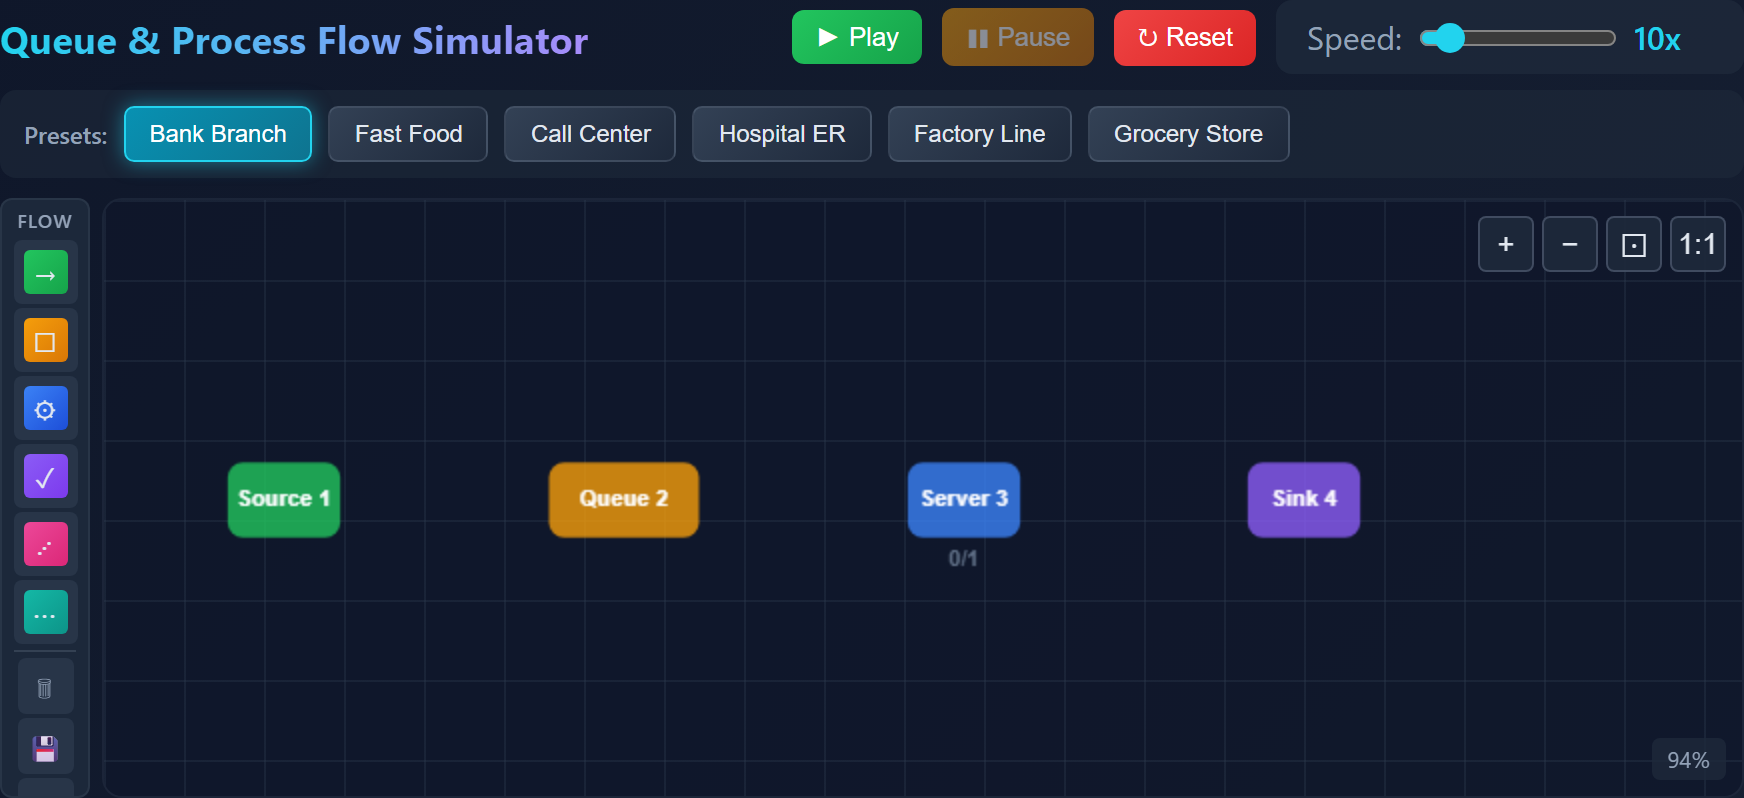
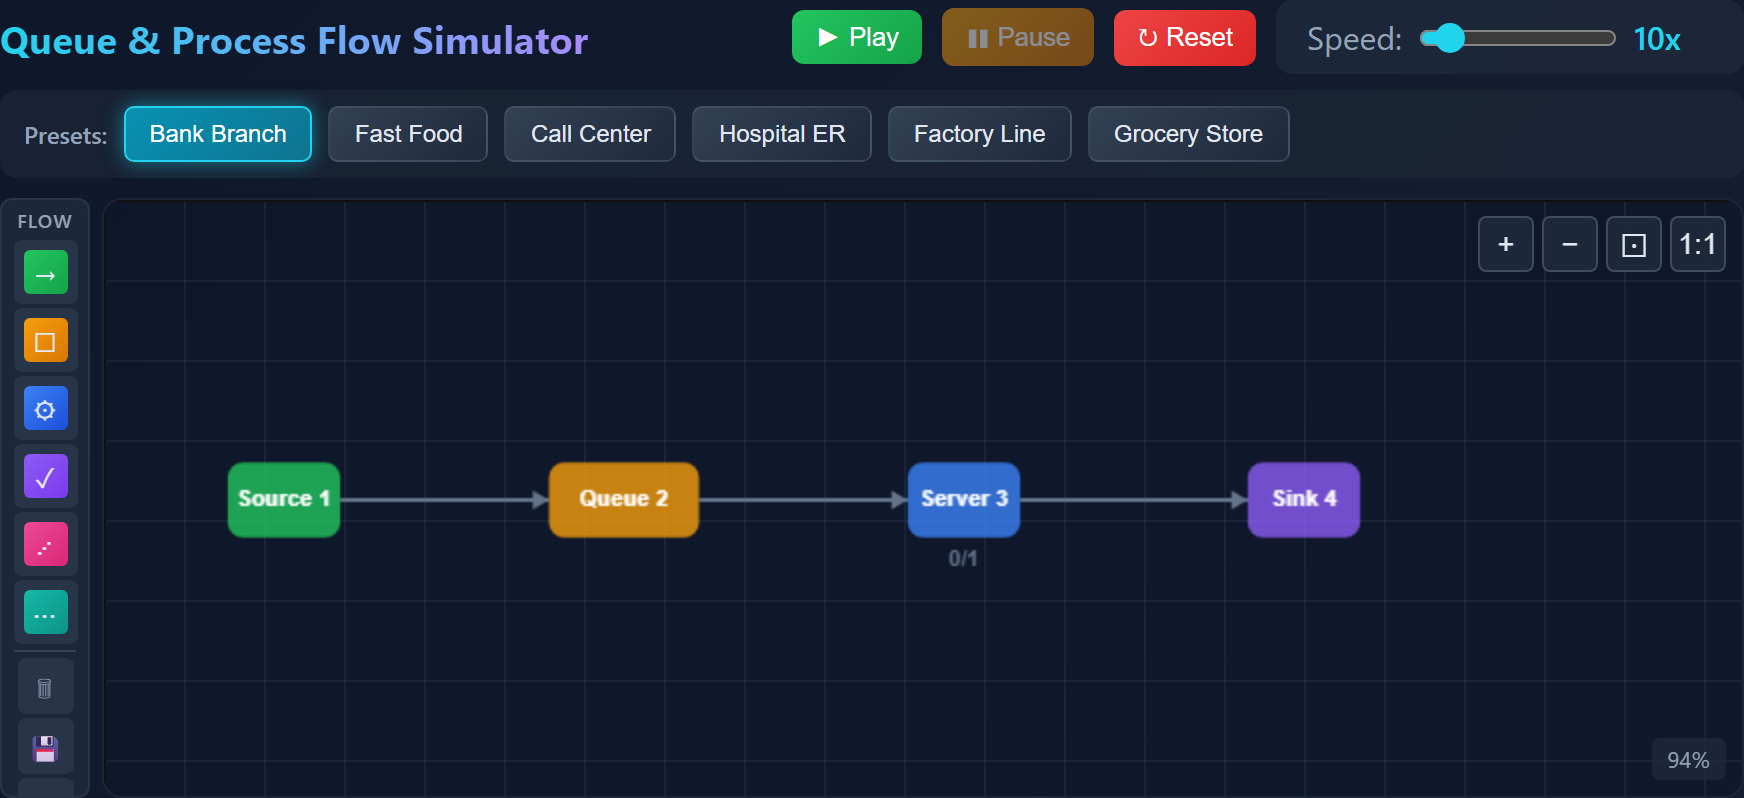
The simulator opens with a sample "Bank Branch" layout already loaded. Clear it out and build the simple pipeline we'll start from: Source → Queue → Server → Sink.
Click the trash-can icon at the bottom of the left-hand component palette to clear the preset and start from a blank canvas.
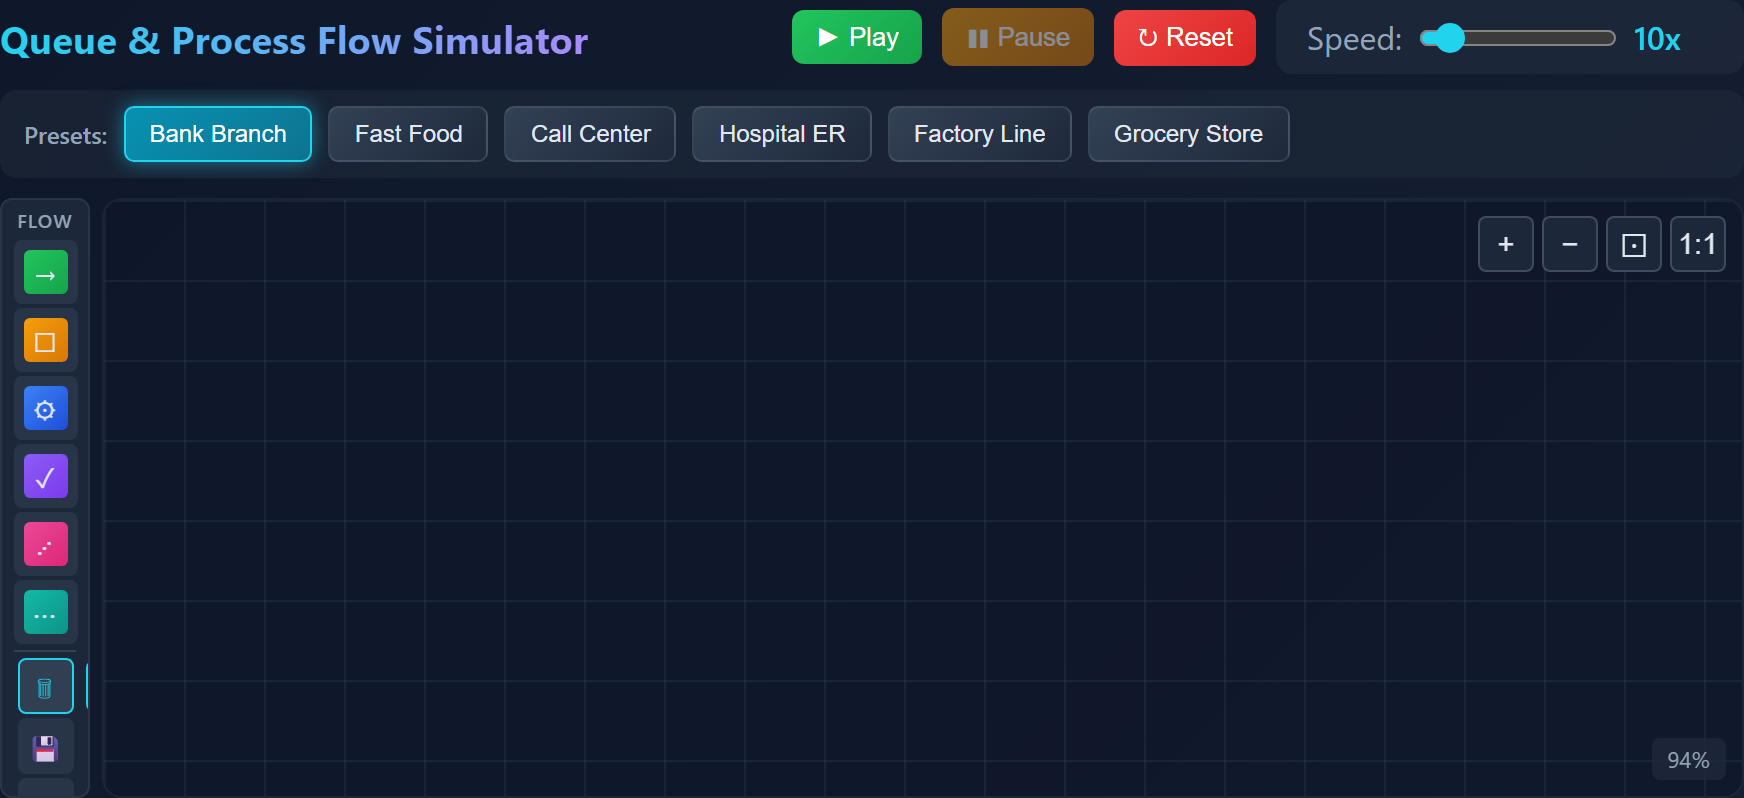
From the palette on the left, drag one each of Source (green), Queue (orange), Server (blue), and Exit (purple) onto the grid, left to right, in that order.
Hold Shift and drag from one node to the next to connect them: Source → Queue → Server → Sink. (Double-click a node to delete it if you need to start a connection over.)
Part 2: Set the Starting Numbers
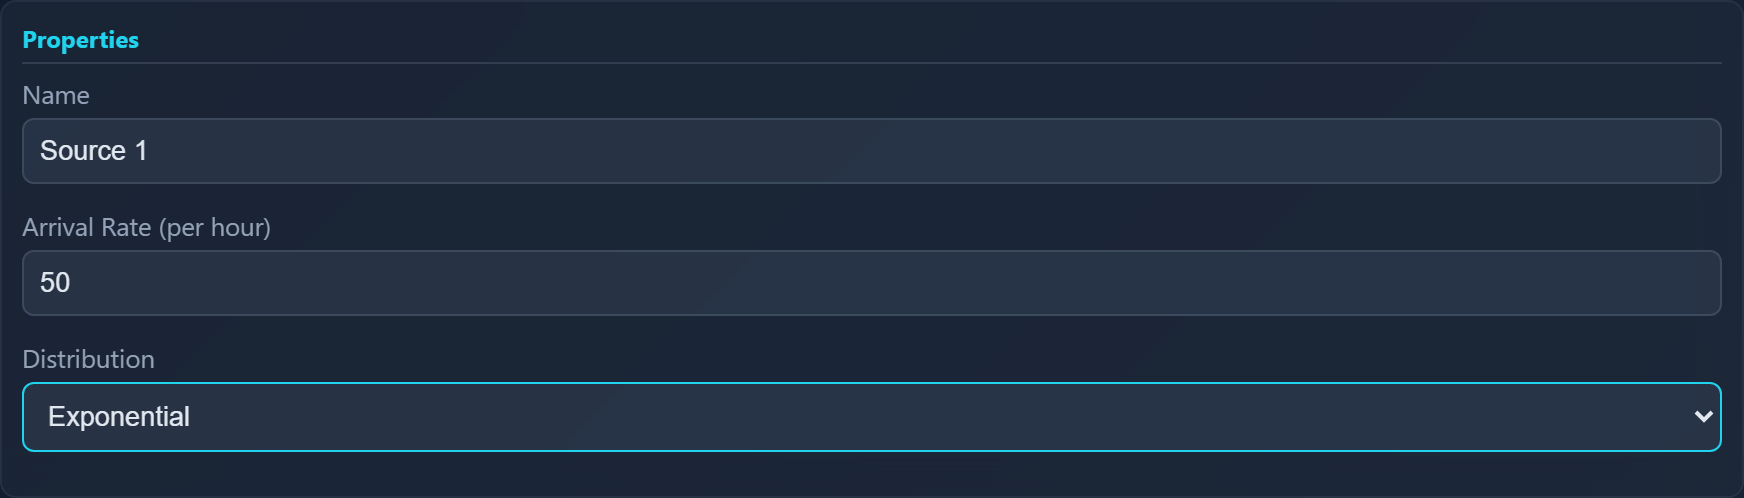
Click a node to select it and open its Properties panel at the bottom of the simulator.
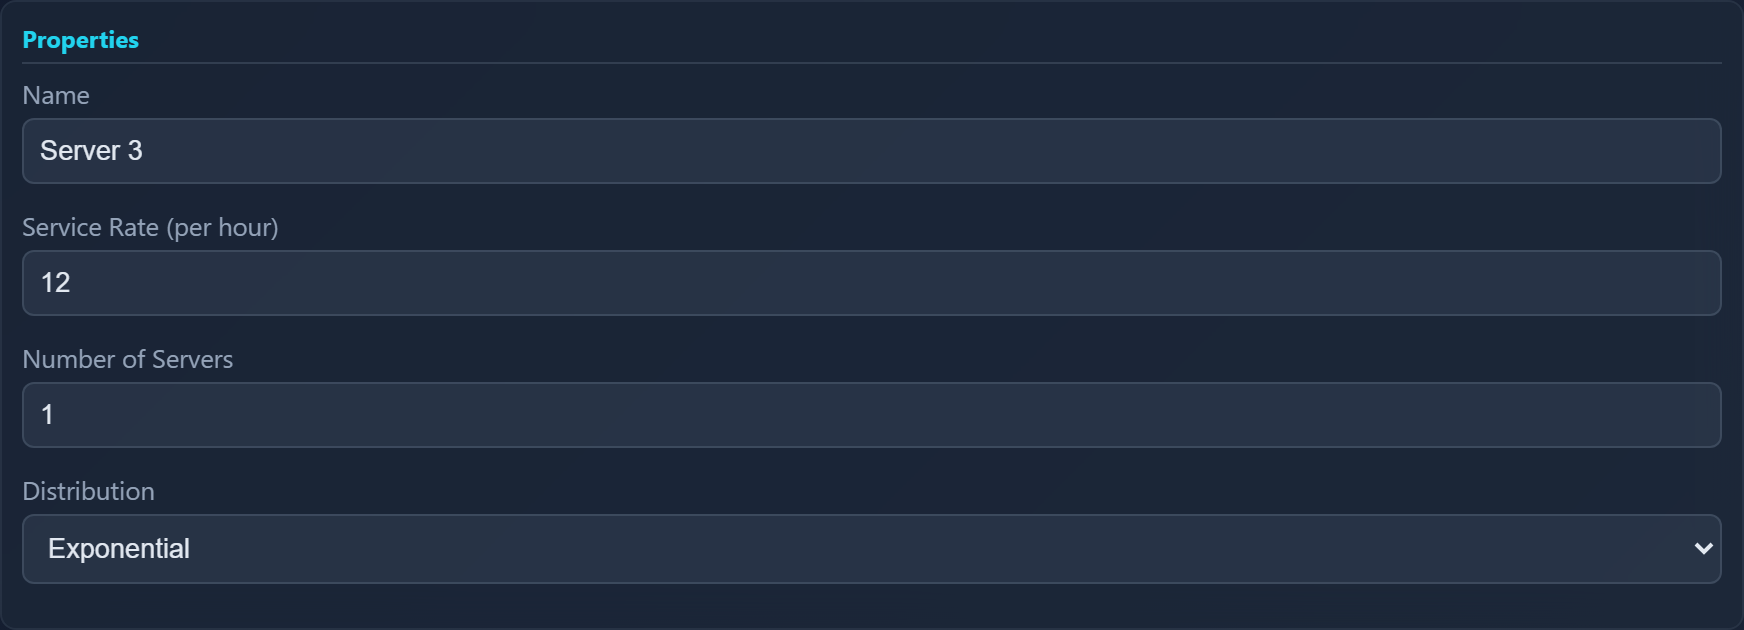
What Happened?
With one small server at 12/hr trying to keep up with 50 arrivals/hr, the queue backs up and keeps growing — it never reaches a steady state. Here's what that run looked like:
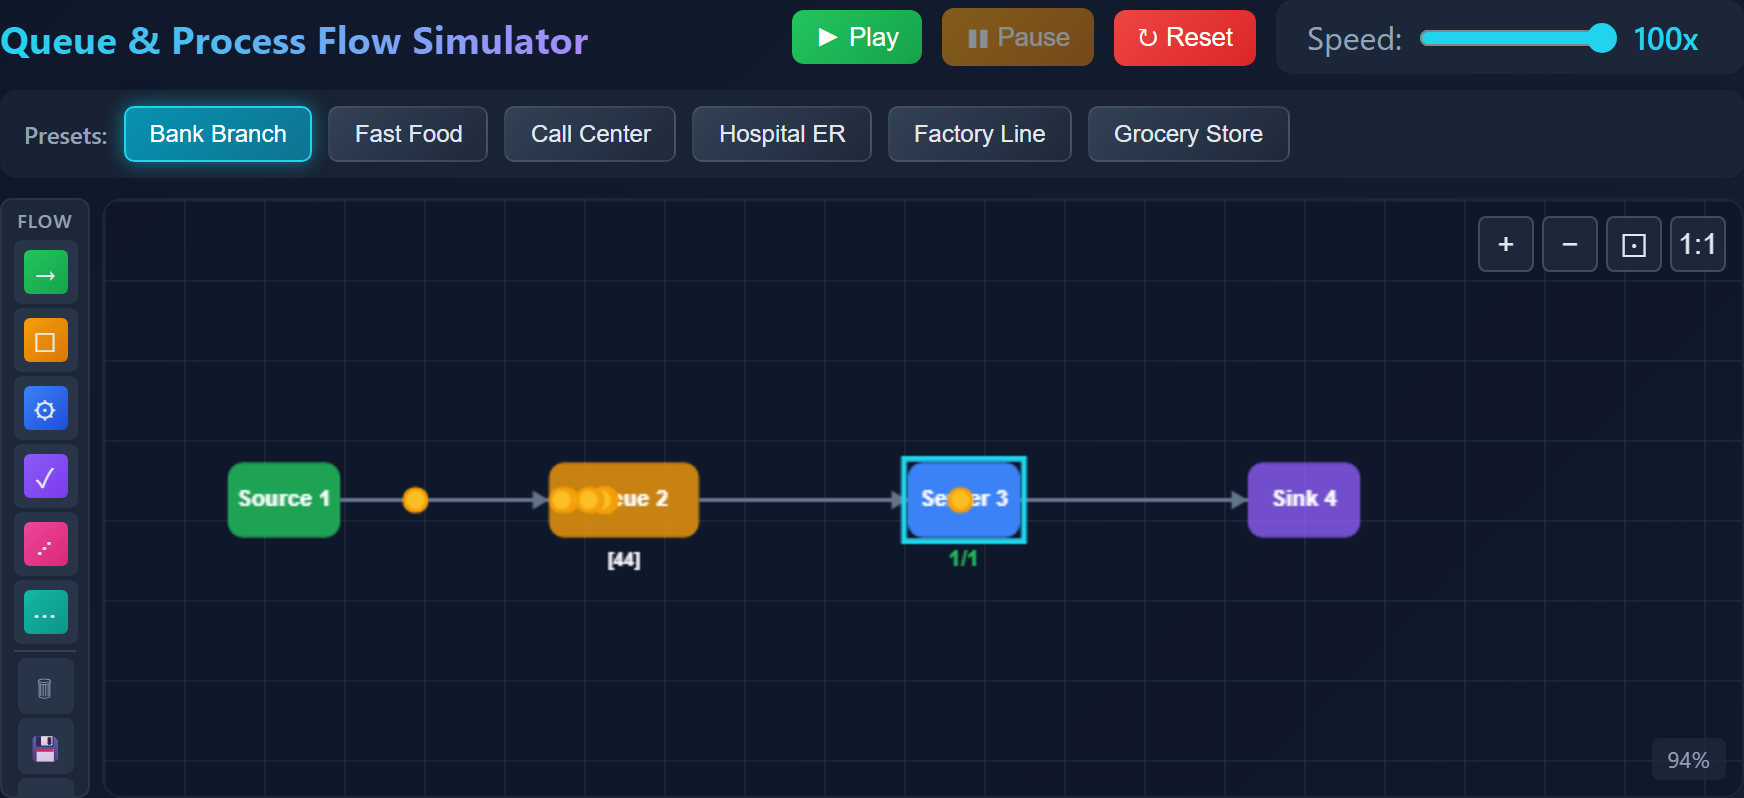
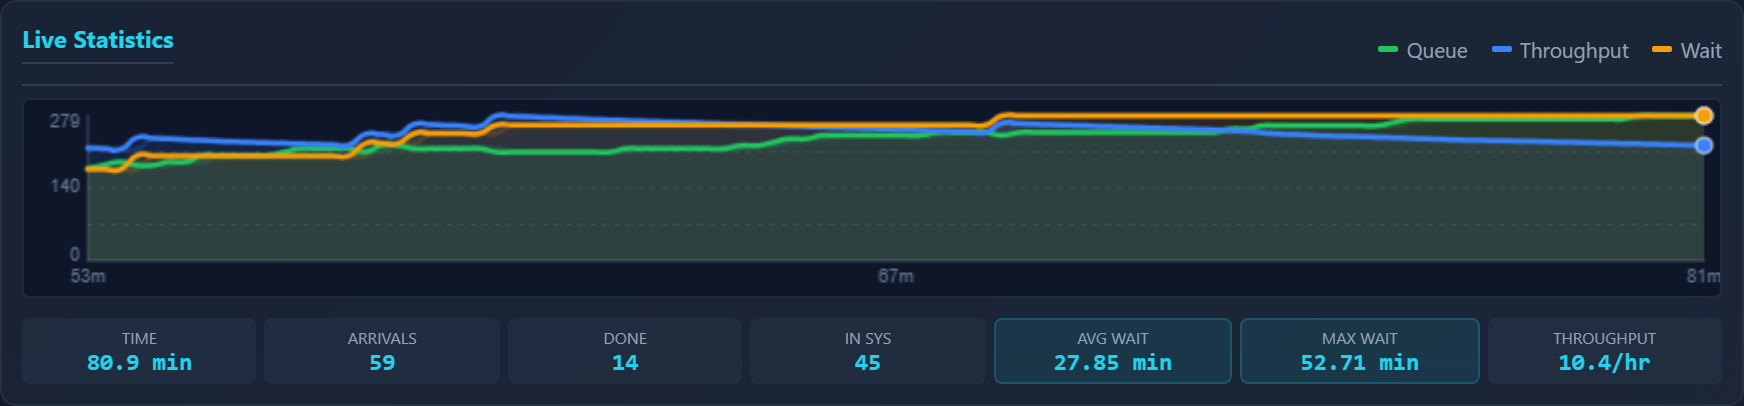

The server is already running near its limit, and the wait time is nowhere close to acceptable. That's your starting point — now redesign it.
Price List
| Component | Service Rate (per hour) | Cost |
|---|---|---|
| Server, small | 12 | $10 |
| Server, medium | 24 | $25 |
| Server, large | 36 | $45 |
| Server, XL | 75 | $120 |
| Queue | — | $2 |
| Router | — | $5 |
- Every server counts, including extras added with "Number of Servers."
- Service rates must match a size in the table above.
- Source and Sink are free.
Bigger servers cost more per request served. Is the simplest design worth it?
Your Goal
- Average wait: under 5 minutes
- Every server: 60–70% busy
- Then: lowest total cost wins
You may add and rearrange components freely, choosing server sizes from the price list above.
Report Back
- Your design (sketch it)
- Average and max wait
- Each server's utilization
- Total cost