Samuel A. Malachowsky
Senior Lecturer, Department of Software Engineering
Project Management Professional (PMP)

Give students an opportunity to use the seven basic quality tools as a system, rather than as separate ideas.
 Quality, Classroom Activities
2014-10-02
The 7 Quality Tools Class Activity
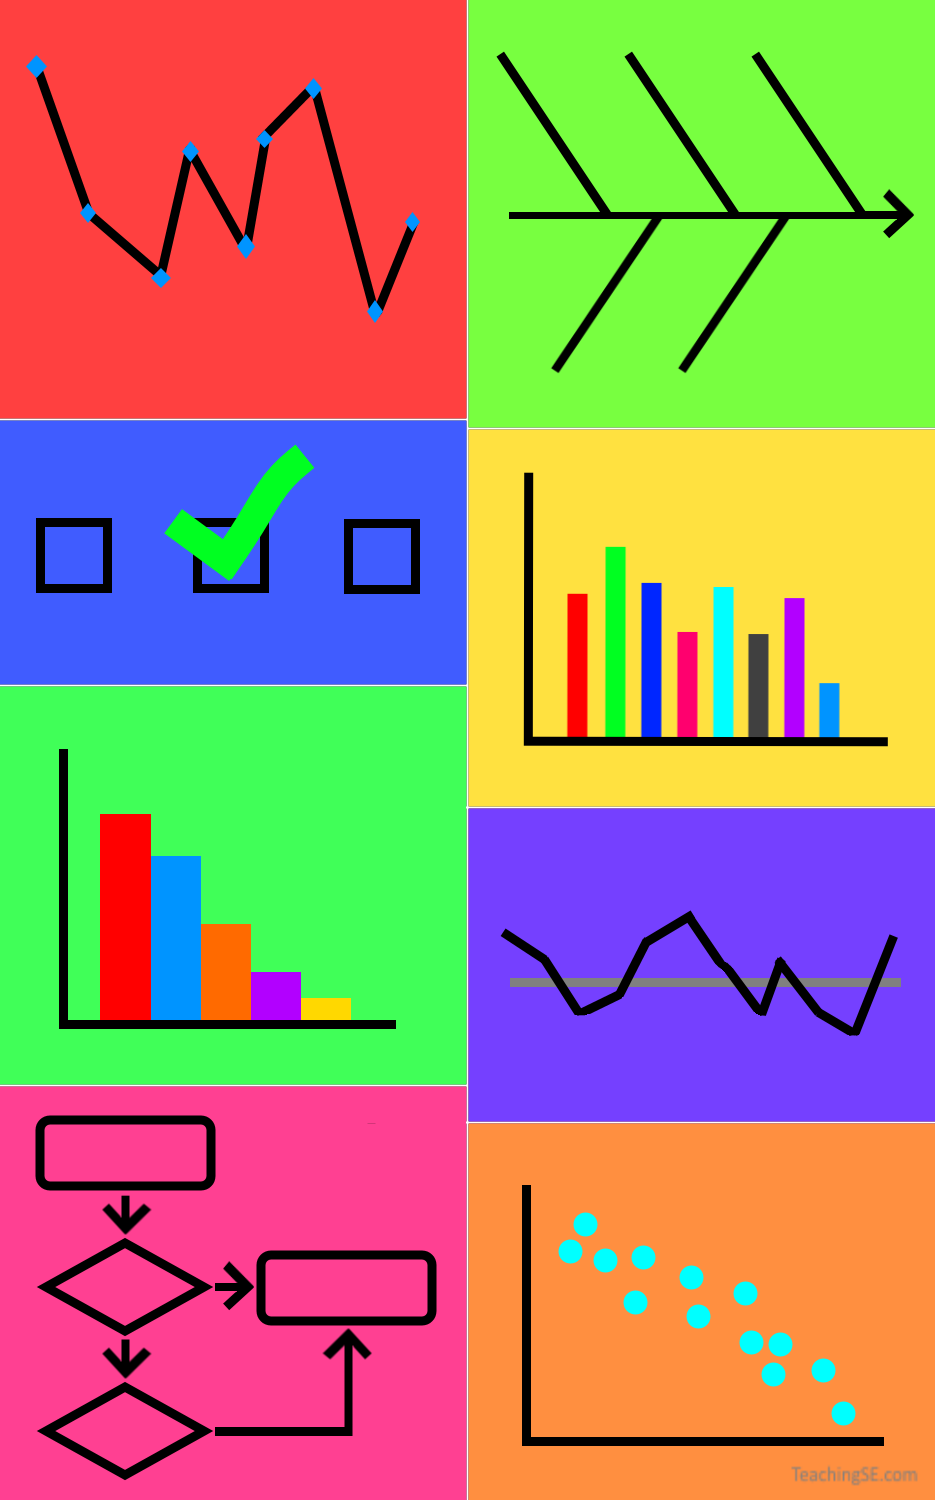
The "Seven" Basic Quality Tools
No quality process class is complete without a nod to Deming and Ishikawa. The idea of the seven basic quality tools is fundamental not only to the assertion of quality, but to turning measurements into metrics - i.e. making them useful for analysis and ultimately decision making.
In explaining the seven basic quality tools (often added to, substituted, or simply used as a reference for an list), one area I fear may be overlooked by students is how they are complimentary, or used together. Thinking of them in this way, you can easily divide them into groups, keeping in mind that some may fall into more than one category:
- Monitoring - With the result being a suspected issue
- Check Sheet
- Run Chart
- Control Chart
- Analyzing - Digging into the problem more
- Cause-and-Effect (Ishikawa, Fishbone) Diagram
- Scatter Diagram
- Histogram
- Prioritizing - Deciding where to concentrate effort
- Pareto Chart
- Planning & Executing - Enacting lessons learned
- Flowchart
- Checklist
- Forms with Required Fields
In order to reinforce this, I've used the following class activity successfully with underclass students, directly after a 15-20 minute lecture covering the tools and important concepts.
Exploring what it takes to have a great Thanksgiving holiday
First, divide the students into teams of 3 or 4, and have them choose a non-software situation that everyone in the group can relate to, and what the intent of the situation is. If they are unable to come up with one, ask the class for ideas or inject some of your own. Some examples:
- Having a great holiday
- Avoiding a car accident
- Throwing a birthday party
- Quickly cleaning a house
- Having a productive team meeting
Choosing the Thanksgiving elements with the highest impact
Once each group has settled upon or has been assigned a topic, have them complete a fishbone diagram - encouraging them to go several layers in. A classroom whiteboard is a perfect medium for this, as it allows easy edits.
Next, have the group complete some comparative analysis/prioritization on the diagram:
- Choose between 5 and 10 "bones" from the cause-and-effect diagram. This can be done by having each team member choose a few or by consensus
- Rate them against each other. An easy way to do this is to have each team member assign them percentages so that they add up to 100, then average them together.
- Complete a Pareto analysis of these items, ranking them from most important to least.
Using a checklist to ensure flawless execution of Thanksgiving
Finally, with analysis complete, a quality plan needs to be created. Have the students choose one of the Pareto items and formulate a checklist, flowchart, or form with required fields. The output is intended to allow users to learn from their analysis (although only a small portion of it) and heighten the impact of lessons learned.
Once the activity is complete, you may wish to have students present their findings to the rest of the class or turn it in for grading. If whiteboard were used and grading is required, tell the students to take a picture using a smartphone and confirm receipt and clarity of the image before erasing.
There will be some interesting variance in what the students come up with for this activity - some of the topics or resulting analysis may surprise you or even make you laugh. Ultimately, the students will learn how the 7 basic quality tools can be used together to close the quality loop - from monitoring to analysis to prioritization to planning and execution.
Distributed/Scaled Agile Class Activity 
In this classroom activity, the difficulties associated with distributing project work between agile teams is demonstrated and resolved.
( Agile, Classroom Engagement, Classroom Activities, 2017-03-23)
Effectively Presenting Lists Activity
Use this activity to creatively give students a "hook" in remembering lists.
( Classroom Activities, Classroom Engagement, 2015-02-06)
Explaining the Concept of a Maturity Model
What is a maturity model? Use this simple analogy when introducing the concept.
( Quality, Classroom Engagement, 2014-11-06)
Additional Articles:
Instructional Changes Brought About by COVID-Necessitated Classroom Tools
The teaching environment and tools nescecitated by the COVID pandemic has enabled some surprising new teaching efficiences.
( Classroom Engagement, Online Teaching, 2020-10-21)
Engineering a More Effective Resume Video
Watch this video to learn how Engineers should approach adding skills and experience to their resume.
( Resume, Career, 2020-09-25)
Three Things You Should Know About Software Engineers
Here are three things that you should know about the way Software Engineers approach the world around them
( Career, 2019-03-18)